IndiaCharts - Stock Analysis 1.7.5
Free Version
Publisher Description
IndiaCharts - Stock Analysis - Get daily analysis & market news on Indian stock market with Elliott Wave theory
𝐈𝐧𝐝𝐢𝐚𝐂𝐡𝐚𝐫𝐭𝐬 began its journey in 2001 with the weekly depiction of the true status of the Indian stock market and transformed into an investor’s daily go-to guide for trading and investing.
𝐈𝐧𝐝𝐢𝐚𝐂𝐡𝐚𝐫𝐭𝐬 offers the truth about the market and helps investors informative decisions. With institutional-grade analysis, market ace Rohit Srivastava unveils the latest trends in the Indian stock market.
𝐈𝐧𝐝𝐢𝐚𝐂𝐡𝐚𝐫𝐭𝐬 is the only app that uses Elliott Wave Theory to analyze the market movements. The daily and monthly updates reflect the stock price movements in the segments, like commodity market, currency market, stock market, etc. The principle of Elliott Wave Theory lets traders study the technical pattern and predict the market trends in the most accurate way possible.
Being the sole provider of the Elliott wave analysis for the different market segments, IndiaCharts tends to be the most reliable and best stock analysis app globally.
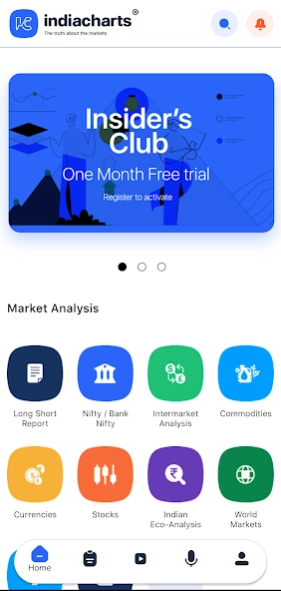
𝐋𝐨𝐧𝐠 𝐒𝐡𝐨𝐫𝐭 𝐑𝐞𝐩𝐨𝐫𝐭𝐬
The Long and Short report is developed, depending on the Elliott Wave Structure Medium and Long term. In addition, an in-depth Market Outlook Report is created according to the status on the Kondratieff Cycle, which is developed keeping into account the economic growth, inflation, and interest rates.
This cycle is considered the Long Wave Economic Cycle for India.
IndiaCharts’ short-term report emphasizes daily and weekly charts to provide the overall stock market scenario view to traders and the best alternatives available to them.
𝐂𝐨𝐦𝐦𝐨𝐝𝐢𝐭𝐢𝐞𝐬 𝐌𝐚𝐫𝐤𝐞𝐭
Rohit’s Elliott waves analysis is the best way to find accurate scenarios and alternatives for an inflation trade. This segment lets money managers and traders figure out if the world economy is inflating or deflating.
𝐈𝐧𝐭𝐞𝐫𝐦𝐚𝐫𝐤𝐞𝐭 𝐀𝐧𝐚𝐥𝐲𝐬𝐢𝐬 𝐒𝐭𝐨𝐜𝐤𝐬
From letting investors and traders know of the fluctuations in the market to help them identify the bear traps formed by mature traders, our analysis gives them an overall preview of the stock market.
As the name suggests, IndiaCharts reflects a market-to-market scenario while preparing its analysis report or technical patterns for investors to follow.
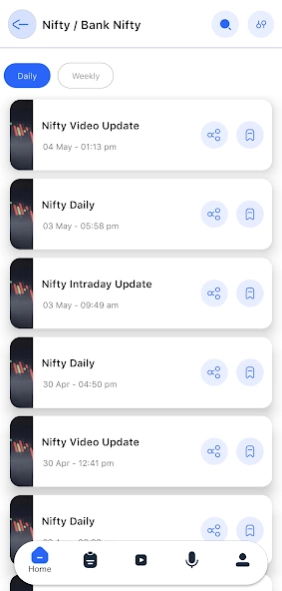
𝐍𝐢𝐟𝐭𝐲/𝐁𝐚𝐧𝐤 𝐍𝐢𝐟𝐭𝐲
This section or segment of IndiaCharts displays the short-term report & the daily trend analysis. The predictive market trend and the best decisions to be taken by investors are indicated using this category. The Elliott waves are derived for both Nifty and Bank Nifty.
The Position sizing model enables users to assess the percentage of risk taken on a particular long or short side. This positioning is done using the results of the technical indicators, like Fibonacci retracement levels, etc.
𝐄𝐝𝐮𝐜𝐚𝐭𝐞 𝐘𝐨𝐮𝐫𝐬𝐞𝐥𝐟
IndiaCharts has a Mentorship Program that prepares useful resources for individuals aspiring to be stock investors or planning to invest in any financial product. The training program assists traders and investors about the nitty-gritty of the stock market so that they have a strong and stable investment portfolio.
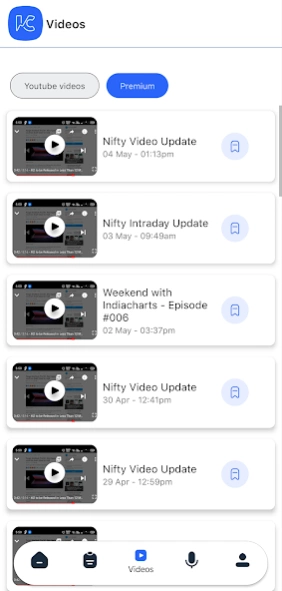
The Elliott wave analysis done by Rohit Srivastava lets them take major financial trading decisions. The certification program consists of pre-recorded videos for aspiring and current investors and traders. In addition, there are live training sessions with mentors to make it more active and interactive.
𝐖𝐨𝐫𝐥𝐝 𝐌𝐚𝐫𝐤𝐞𝐭𝐬
One might be planning to invest in India, but having proper knowledge about the overseas stock market is necessary. After all, studying and analyzing the scenarios outside the nation can assist investors and money managers assess the risks associated with an investment in advance.
Apart from the above categories that help aces like Rohit Srivastava build Elliott waves for accurate and reliable technical analysis, investor sentiments also affect the stock market. The genius shares it all through IndiaCharts with his current and aspiring investors and traders.
About IndiaCharts - Stock Analysis
IndiaCharts - Stock Analysis is a free app for Android published in the Accounting & Finance list of apps, part of Business.
The company that develops IndiaCharts - Stock Analysis is Indiacharts. The latest version released by its developer is 1.7.5.
To install IndiaCharts - Stock Analysis on your Android device, just click the green Continue To App button above to start the installation process. The app is listed on our website since 2023-12-14 and was downloaded 2 times. We have already checked if the download link is safe, however for your own protection we recommend that you scan the downloaded app with your antivirus. Your antivirus may detect the IndiaCharts - Stock Analysis as malware as malware if the download link to com.indiacharts is broken.
How to install IndiaCharts - Stock Analysis on your Android device:
- Click on the Continue To App button on our website. This will redirect you to Google Play.
- Once the IndiaCharts - Stock Analysis is shown in the Google Play listing of your Android device, you can start its download and installation. Tap on the Install button located below the search bar and to the right of the app icon.
- A pop-up window with the permissions required by IndiaCharts - Stock Analysis will be shown. Click on Accept to continue the process.
- IndiaCharts - Stock Analysis will be downloaded onto your device, displaying a progress. Once the download completes, the installation will start and you'll get a notification after the installation is finished.
